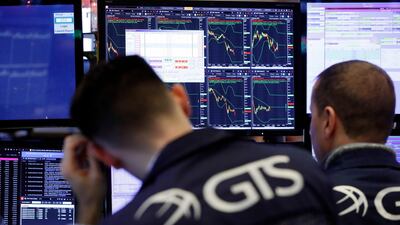
US stocks fell at open on Wednesday, as a closely-watched bond market indicator pointed to a renewed risk of recession, undoing gains from the previous session due to a retreat by Washington on its latest tariffs on Chinese goods.
Germany, Europe’s biggest economy, shrank 0.1 per cent in the spring from the first three months of the year due to the global trade war and troubles in the auto industry. Data from China also showed that factory output, retail spending and investment weakened in July for the world’s second-largest economy, according to Reuters.
“The bad news for global economies is stacking up much faster than most economists thought, so trying to keep up is exhausting,” Kevin Giddis, head of fixed income capital markets at Raymond James, wrote in a report.
The S&P 500 opened lower by 32.17 points, or 1.10 per cent, at 2,894.15. The Nasdaq Composite dropped 139.03 points, or 1.73 per cent, to 7,877.33 at the opening bell.
“The relief rally inspired by the Trump administration delaying tariffs on some Chinese imports was short lived - blink and you missed it,” said Fiona Cincotta, senior market analyst at City Index, the Associated Press reported.
Much of the market’s focus was on the US yield curve, which has historically been one of the more reliable recession indicators.
If all this talk about yield curves sounds familiar, it should. Other parts of the curve have already inverted, beginning late last year. But each time, some market watchers cautioned not to make too much of it. Academics tend to pay the most attention to the spread between the three-month Treasury and the 10-year Treasury, which inverted in the spring. Traders often pay more attention to the two-year and 10-year spread.
Each of the last five times the two-year and 10-year Treasury yields have inverted, a recession has followed. The average amount of time is around 22 months, according to Raymond James’ Giddis.
The indicator isn’t perfect, though, and it’s given false signals in the past. Some market watchers also say the yield curve may be a less reliable indicator this time because technical factors may be distorting longer-term yields, such as negative bond yields abroad and the Federal Reserve’s holdings of $3.8 trillion in Treasurys and other investments on its balance sheet.

