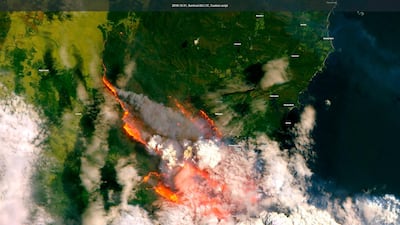
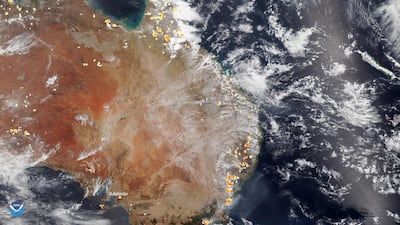
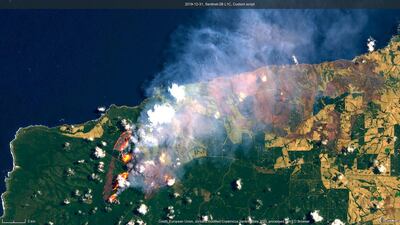
Bushfires have ravaged millions of hectares of land across Australia, killing dozens of people, destroying thousands of buildings and leaving some towns without electricity and mobile coverage.
According to some estimates, about half a billion wild animals have perished in the fires, along with thousands of farm animals.
On Monday, January 6, losses were estimated at A$375 million since November, the Insurance Council said.
And, with the fire season just beginning, it could be months before the crisis is abated and the full impact on people and wildlife is known.
Here are four maps and graphics that show the scale of the bushfires burning in Australia...
1. How big are the fires around Australia?
2. How do the Australian fires compare to previous fires?
3. What is the toll so far?
4. How do bushfires affect the weather?
______________
Read more from The National:
The Australian bushfires from above - in pictures
Australian government pledges $1.4bn to bushfire recovery
Watch: Thirsty koala gulps down cyclist's water during Australian heatwave
Australian bushfire crisis: This is not the time for blame, says Scott Morrison


